
Published on: Aug 28, 2021
Color Science
Color is an important element that exists in nature. Everything we see or feel through the eyes is all about colors. It is necessary to understand the concept of color in domains like image processing, film making, and digital photography, where color is the primary element.
From Space exploration to Film making, Air force to Archeology, color science is applied everywhere that uses colors to gather data. For example Hubble telescope uses image processing techniques like broad-band and narrow-band filtering to color map planets, nebula, and galaxies based on the gases and their interactions like in "The Pillars of Creation".
 The Pillars of Creation (NASA)
In this article, we discuss color, the evolution of color understanding, and numerical representation of color in the digital world.
Color and Human Vision
When we talk about colors, colors are represented in a way human eyes perceive. Because different species see things in different colors, and they can also see what humans cannot see like Snakes and Bats can detect infrared radiation which humans couldn't. So we generally restrict colors to human vision.
Color is an illusion that our brain creates when a light beam reflects off an object/emits from an object and reaches our eyes. When light strikes the surface of an object, some light will be absorbed and some will be reflected. That reflected light with different wavelengths reaches our eyes and we perceive them as different colors.
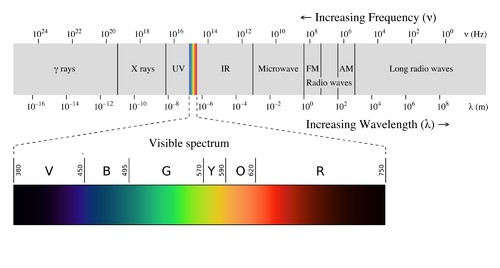
Issac Newton described the color as a quality of light. And the light which is an electromagnetic wave is classified into different segments with certain frequencies and wavelength ranges. The visible light spectrum is the segment of the electromagnetic spectrum that human eyes can only perceive. The visible light wavelength range is ~380 to ~780 nanometers. By deflection of light through a prism, Newton assigned different colors to different wavelengths in the visible spectrum which we generally see when a rainbow appears (VIBGYOR).
The retina in our eye is responsible for vision. The retina contains photoreceptor cells that convert light signals to neural signals and send those signals back to the brain through nerves. And then, the brain intercepts these signals to colors. Rods and Cones in the retina are two types of photoreceptors that are responsible for our vision in dark and bright conditions. Rods work at a low level of light and our vision is in grayscale. Rods don't provide any color vision. At night as there is a low level of light we can see the objects in combinations of white and black (grayscale). Cones work in bright light and provides color vision.
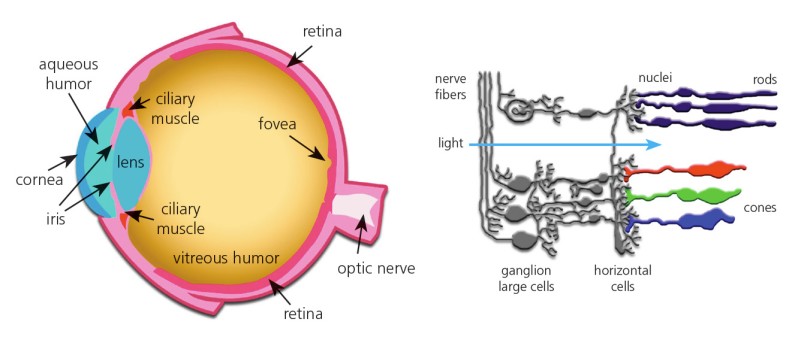 Light capture by Rods and Cones in Retina
Triochromatic theory
In the 1800s, Thomas Young stated that the human eye consists of three different types of color receptors more likely red, green, and blue, and mixing these colors create other colors.
There are three types of cones called short (S), medium (M), and long (L) which are sensitive to different wavelength ranges of spectral distribution and detect Blue, Green, and Red respectively.
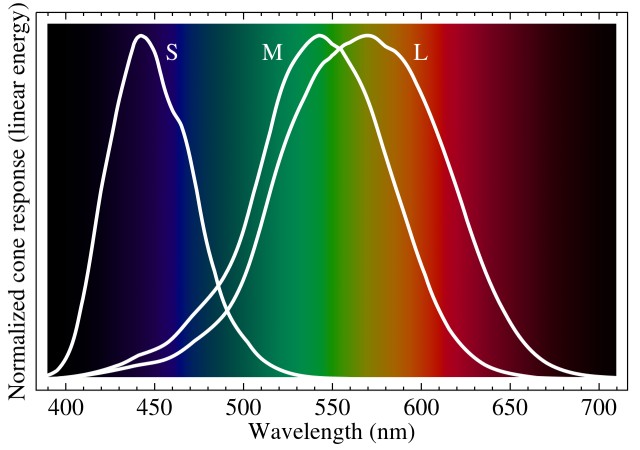 Normalized Responsivity of S, M and L cones
These S, M, and L cones detect Blue, Green, and Red colors respectively and other colors are perceived by overlapping of different stimulations of these cones. The brain then integrates these cone signals and detects millions of colors. For example, Yellow color is a proportion of Green and Red cones and no or less effect of Blue cone. These three colors RGB (Red, Green, Blue) are primary colors and any color can be produced with the combination of these primitive colors.
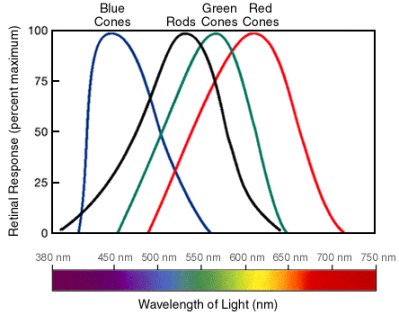 Retinal Response of rods and cones
If we mix all RGB colors at a high-intensity level we get White color, and if RGB colors with 0 intensity level produce Black Color.
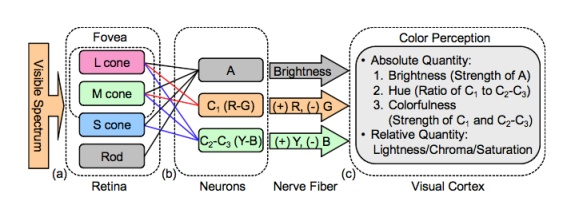
Opponent process theory
After cones converting physical (light) signals to neural signals, these neural signals reach the brain through nerves. Here, cells changes behavior and responds in the opponent manner for colors. The photoreceptor cells are in inter-connection with each other cell and give positive or negative responses for incoming color signals. Some cells fire positive signals when seeing red color, and activate negative signals for green color. These opposite responses don't happen at the same time in a cell. The opponent-process theory states that color perception is controlled by three opponent color systems: red-green, blue-yellow, and white-black (according to recent studies, these pairs are blue-yellow, red-cyan, and green-magenta). These opponent colors don't perceive as together because cells can only fire one of the colors in a pair i.e. there is no "bluish-yellow" or "greenish-red".
These trichromatic and opponent-process theories give an idea about how our brain receives and processes light signals into colors.
The Color of an object
When a light beam hits the surface of an object, it absorbs some wavelengths and reflects a particular wavelength of light. An object looking Pink absorbs all wavelengths of light except some portion of Red and Blue. And our eyes receive those Red and Blue colors by cones and intercept as pink by stimulating the Red and Blue cones. Paints on walls are made to absorb all of the wavelengths except the color of their appearance.
Secondary colors
If we mix two primary colors at equal intensities and another one is being kept at a 0 level, we get secondary colors.
- Cyan (Blue + Green)
- Magenta (Red + Blue)
- Yellow (Green + Red).
These Cyan (C), Magenta (M), and Yellow (Y) colors are called secondary colors (CMY) as they are derived from primary ones (RGB).
C, M, and Y are also complementary colors to R, G, and B as synthesize of C, M and Y don't contain R, G, and B colors respectively. This means when an object is illuminated with RGB colors, the object absorbs at least one primary color and reflects the other two primary colors. An object looking Cyan would absorb Red but reflects Green and Blue (G + B = C). Mixing secondary colors produces RGB colors.
- M + Y = R
- Y + C = G
- C + M = B
Additive and Subtractive color mixing
The object appears in different colors if the various amount of RGB light emitted from it. It appears black when no percentage of RGB is emitted and if all are emitted at the highest intensity, it appears as white. Thus adding different RGB percentages produce different colors. This process of synthesizing colors by emitting RGB colors from black (when no light is produced) is called Additive color model. We start from black and reach white. Display monitors and screens we see around are based on an Additive color model. They produce colors by varying RGB color intensities.
What if an object instead of emitting it reflects certain wavelengths of light by absorbing other wavelengths. This is how we naturally see an object and its appearance. An object absorbs some light and reflects other visible spectrum wavelengths that are perceived as color by our eyes. If an object absorbs cyan color, then it reflects red. Because
if we subtract cyan from white it produces a red color.
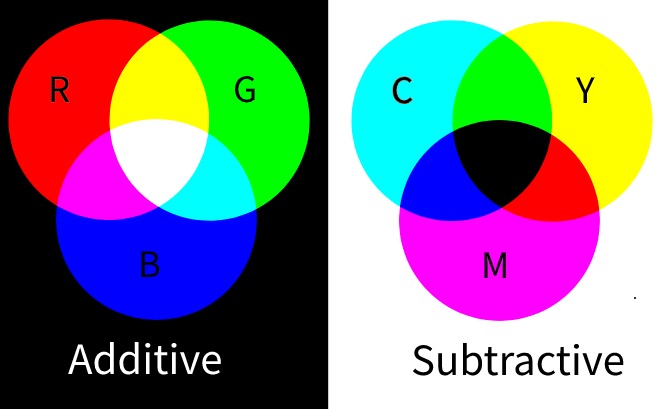
Here subtracting means mixing colors as an object absorbs colors and then reflects. Thus mixing CMY colors with a white color produces different colors. This process of synthesizing colors from adding CMY mixtures to white is called Subtractive color model. We start from white to black color. Printing and painting involve this color synthesis to generate different colors on white paper or canvas. As mixing of CMY at the highest intensity produces brown color, printers also use black (K) color to generate shades of the black, and the resultant color group is called as CMYK color model.
Color matching
Color matching is representing and reproducing any color wavelength using primary monochromatic wavelengths. Using different intensities of primary colors, the target color wavelength is produced.
Grassmann's laws of additive color mixture
In 1953, Grassmann recognized that any color can be matched with a linear combination of three primary colors. Grassmann's laws describe the relations between primary colors to match any color by additive color mixture. The following Grassmann's laws are fundamental for color mixing,
-
If two colors (X and Y) are the same, then mixing X and Y with the third color Z would still look like same.
-
Any color C can be produced by a linear combination of three primary colors but no primary color is matched by a combination of the other two.
where (x, y, z) are portions of primary colors (X, Y, Z) required to match color C.
-
Two colors C1 and C2, if mixed to form another color C3, then C3 can be matched by a linear combination of mixtures of primary colors that are used to produce C1 and color C3.
-
Colors that are produced by mixing primary colors have constant luminance. This is not true at various lighting conditions like in photopic (daylight) vision, objects appear in different colors, but in scotopic (night) vision, objects appear in grayscale.
Human tristimulus response
In the 1860s, James Maxwell stated that using RGB primary colors, all other colors can be generated but it is not possible to generate all colors only by addition and requires subtraction also to match certain colors. This is called the human tristimulus response.
2° Standard Observer color-matching experiment
In the late 1920s, based on the works of Newton, Grassmann, and Maxwell, David Wright and John Guild independently conducted experiments to quantify the color reception ability of a normal human observer. They believed that human color receptors are located within the 2° arc of the fovea back from the retina, and asked standard observers or human volunteers to look through a hole that provides a 2° field of view. They asked volunteers to match the target color by adjusting combinations of red, blue, and green colors.
As not all colors could be matching using an additive color model of red, blue, and green, the target color is mixed with some portion of the primary color, and the other two primary colors are altered in portions to match the target colors.
The Commission International de l’Eclairage (CIE), based on Wright-Guild's 2° standard observer data, published RGB color matching functions to represent colors as a combination of three primary colors. This is also called CIE standard 2° observer.
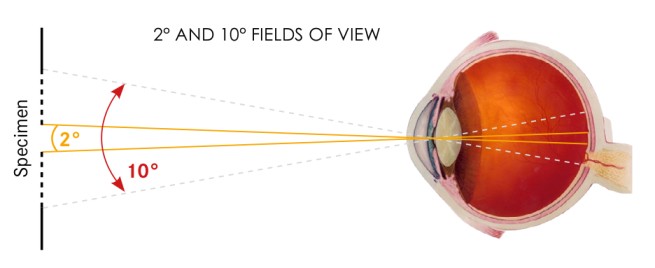 2° and 10° standard observer view
10° Supplementary Standard Observer color-matching experiment
In the 1960s, researchers observed that cones present in the retina cover a larger field than the standard 2° view. Three researchers, Stiles, Burch, and Speranskaya again repeated color matching experiments with a 10° field view. They believed 10° color matching experiments would cover more spectral response than 2°. And it was right. In 1964, the CIE published 10° Standard Observer based on a 10° color-matching experiment. The 10° standard observer is recommended than 2° as it covers larger color representatives.
CIE 1924 Spectral Luminous Efficiency function
Human eyes perceive different wavelengths of the visible spectrum at different brightness levels for the same radiance energy. Sensitivity is zero at either end of the spectrum thus we receive 0 brightness and no color.
The luminous efficiency function describes the human eye's sensitivity for different wavelengths. The more sensitivity observed the more brightness the color is. Eyes are most sensitive at 555nm at daylight (photopic) and 507nm at night (scotopic). CIE luminosity curve tells the relative sensitivity of the human eye for different color wavelengths. The luminous efficiency function distinguishes the brightness level of two colors at equal luminous. We can derive relative brightness for different colors with function.
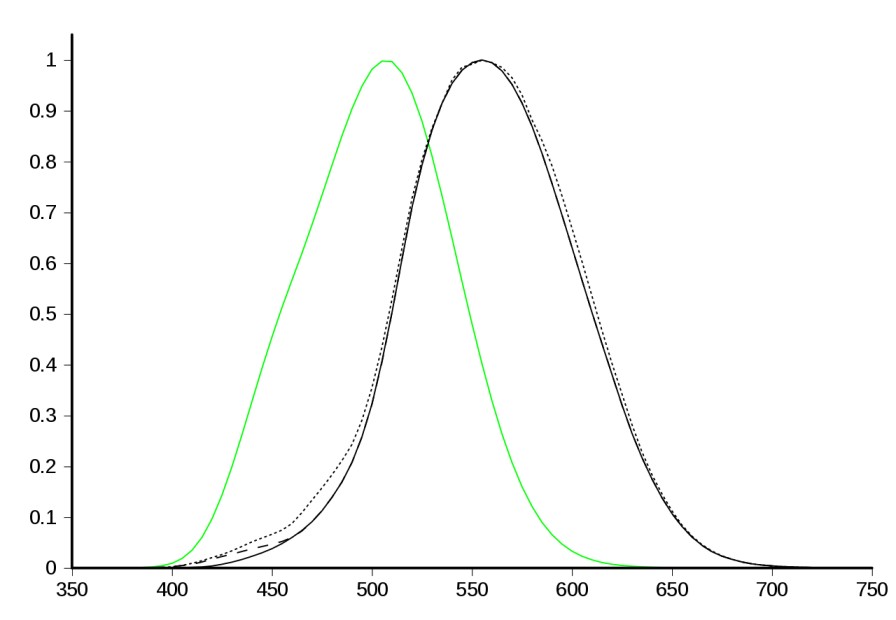 Photopic (black) and Scotopic (green) luminosity function
From luminous efficiency function, we can observe that, for equal radiance energy, brightness order of RGB is green>red>blue. For two colors at 500nm and 570nm to look as equal brightness, the color at 500nm should be more luminous than 570nm. function is an approximation function and accurate in some cases (like color blind people).
Relative luminance of RGB primaries
The above CIE RGB color matching functions are scaled in assumtion that all colors have same brightness. The , and are normalized to have equal area under curve to yield . The integrated area is assumed to be same that
Solving the above expression gives the relative luminanace ratios for r : g : b = 1 : 4.5907 : 0.0601. If we compare luminous curve for R = 700nm, G = 546.1nm and G = 435.8nm, (r, g, b) luminance ratios are approximately matches.
If ratios are normalized such that sum of ratios equals to 1, then r : g : b = 0.2126 : 0.7152 : 0.0722.
To match any target color, RGB colors are mixed in portions obtained from the CIE RGB color-matching function, and then those resultant RGB values should multiply by relative luminance ratios to get the target color with exact brightness.
CIE 1931 RGB color matching functions
The Color matching functions are mathematical estimation of color response of each primary color relative to human observer in 2° view field. Color matching functions gives amount of primary color energy required to generate target color wavelength. CIE defined three color mathcing functions which are normalized weight factors.
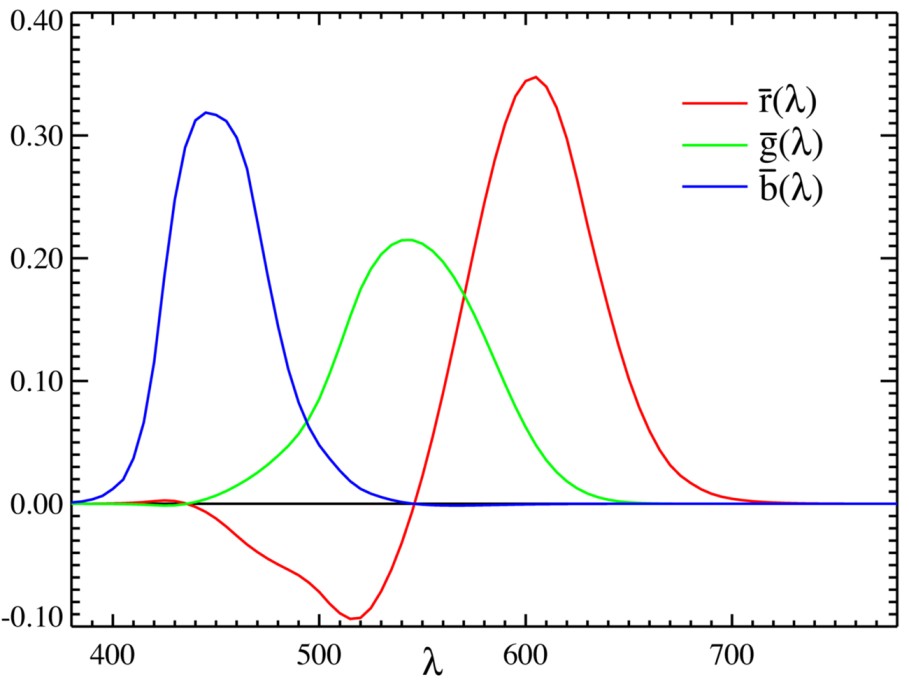
In the above RGB cmf diagram, each color wave represents RGB spectral intensities at various wavelengths. The three primary colors have peak sensitivity at wavelengths R = 700nm, G = 546.1nm and G = 435.8nm. The distribution of spectral energy is normalized and adding all color matching functions equals 1. Negative values in the graph indicate primary colors have to be mixed with the target color before color matching. And slightly matches the luminous efficiency function.
RGB Tristimulus values
The tristimulus values are, in a color space, the amount of color proportions of primary colors are required in a trichromatic additive color model to produce a color.
For CIE 1931 RGB color space, the RGB tristimulus values for spectral distribution of color can be calculated as
where is spectral intensity of a color.
It can also be expressed as, for a color ,
where , and are tristimulus values, and scaled to unit length.
CIE XYZ color matching functions
RGB color matching functions contain negative intensities in mathematical form but they are not practically suitable for the physical world. CIE then converted RGB color space to XYZ color space where XYZ are linear combinations of monochromatic colors RGB. The new XYZ color matching functions have only positive intensities. The derived XYZ parameters are imaginary and they roughly represent S, M, and L cones.
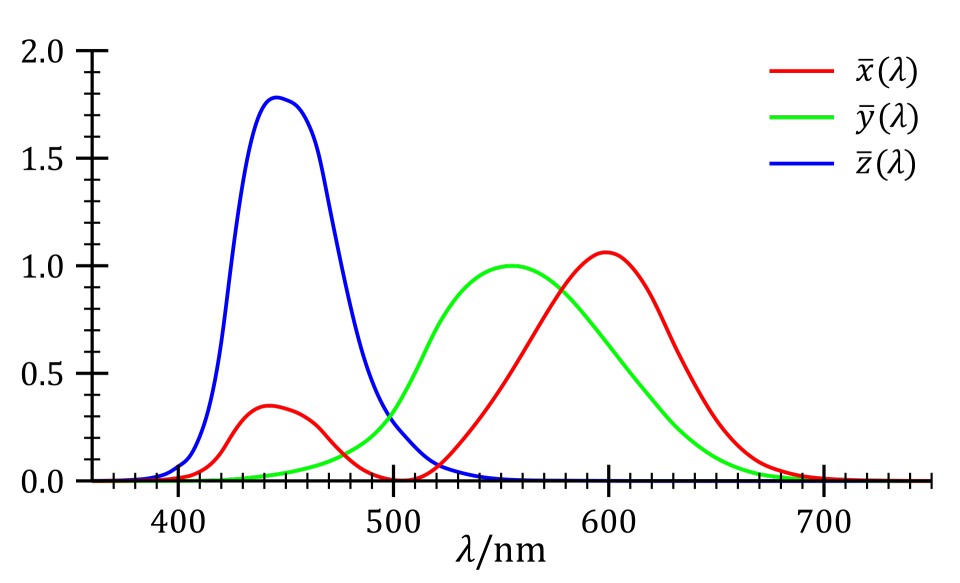
are color matching functions. From above diagram, we can say Violet (around 450nm) color is a mixture of Red and Blue which is indeed true and this cannot be seen in RGB color matching function curves.
CIE XYZ tristimulus values calculation
For light source with spectral radiance ,
where is the equivalent monochromatic light (nm) for a range of wavelengths [380, 780]nm.
For reflective or transmissive object case when illuminated by light source, replace spectral radiance by spectral reflectance (or transmittance) , multiplied by the spectral power distribution of the illuminant
where is scaling factor (1-100), and
Due to absence of analytical expressions of color matching functions, the above integration is transformed to summation of equal intervals of 10nm over spectrum wavelength range [380, 780]nm.
XYZ from RGB
Distribution of is close to luminous efficiency function. So Y component roughly describes the luminance of the color. X is a combination of RGB colors and Z represents blue color. With Y, XZ represents all possible chromaticities (color without luminance).
XYZ is a linear combination of RGB colors. If RGB colors are vectors with unit length and act as vector basis, they form a three-dimensional vector space. And XYZ vectors form a new basis vector by a linear transformation M of RGB vector basis.
From the above transformation matrix M, we can say Red and Green colors have zero or no impact on Z which can be confirmed from RGB color matching functions. Also, Y is a combination of weighted RGB values of relative luminance.
CIE xy chromaticity diagram & CIE xyY color space
Imagine if XYZ tristimulus values are represented as vectors, they form a 3D vector space and contains all possible colors with RGB combinations in a cube. Now trace out the coordinates of XYZ for different wavelengths in the visible spectrum, the closed curve that is formed by joining all coordinates is called spectral locus.
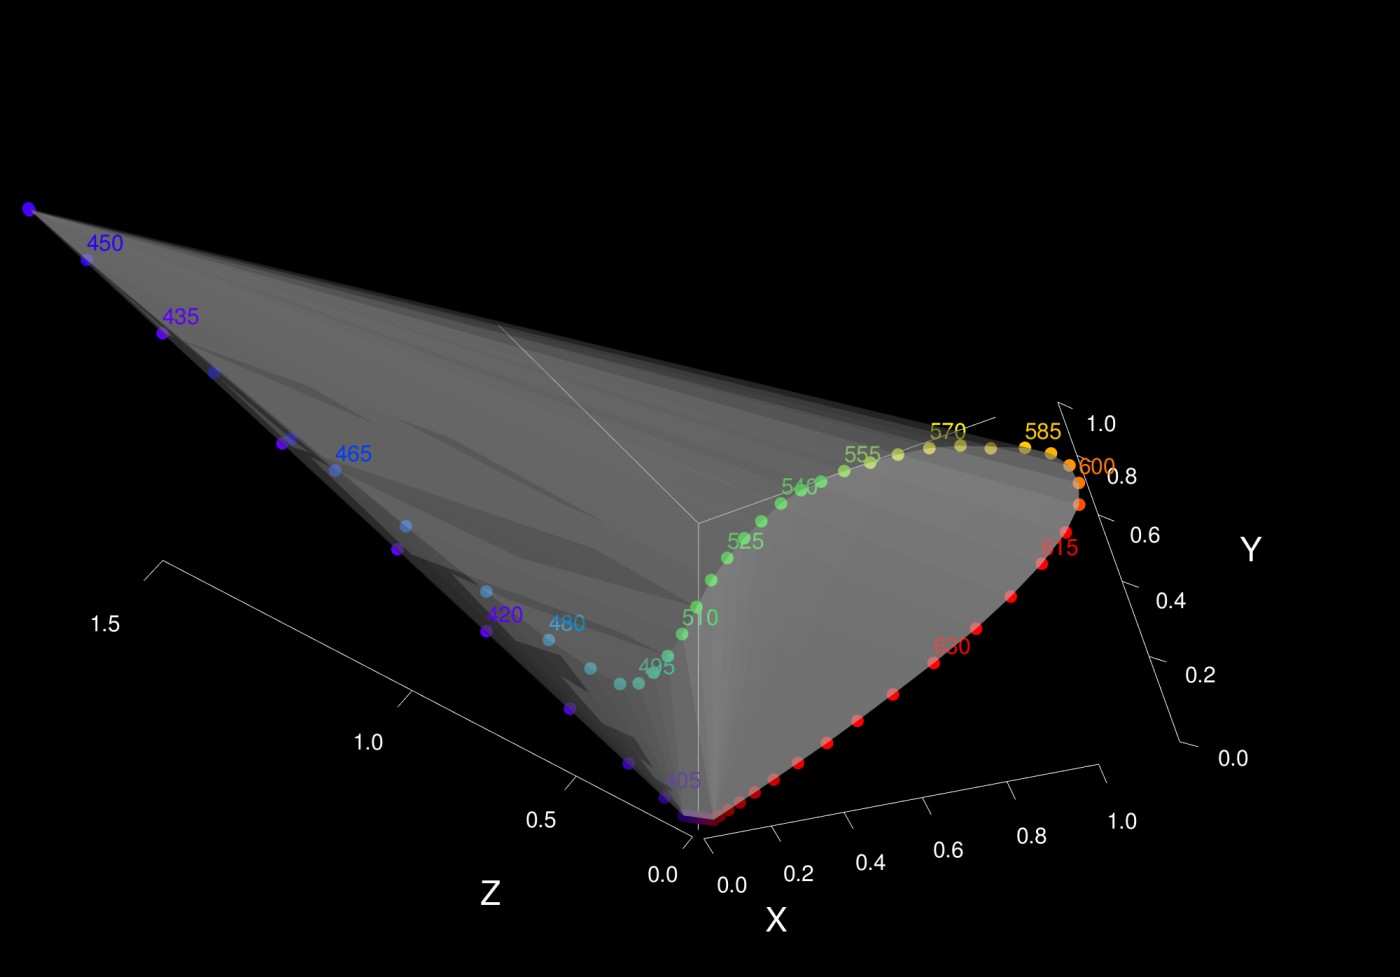
The above 3D XYZ color space contains colors with Hue, Saturation, and Intensity/Brightness. It requires three parameters (H, S, and V) to describe a color (each for hue, saturation, and intensity).
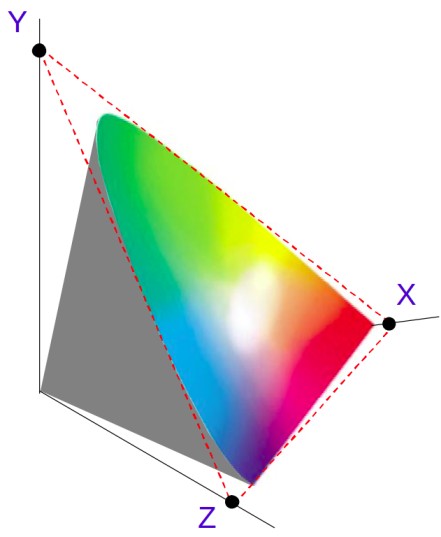
If (X, Y, Z) are projected to plane in XYZ vector space, then normalized representation of (X, Y, Z) is
Summing up the normalized x, y and z components equals to 1 i.e, and
The planar projection of the above spectral locus to the plane forms a planar triangle.
Chromaticity is a color property without intensity i.e color independent component of a color. Chromaticity is the quality of a color determined by its dominant wavelength and its purity (chroma/saturation). In chromaticity, only hue and saturation are used to describe the colors. That means light blue and dark blue have the same hue and saturation values, and same color matching functions.
A chromaticity diagram is a representation of 3D XYZ color space in 2D space with only chromaticity values (hue and saturation). As , any component can be derived from two other components. So z can be derived from x and y as
Any tristimulus value can be derived from other tristimulus values. With Y, X and Z are derived as
If the above spectral locus triangular plane in xyz-plane is projected onto xy-plane, a chromaticity diagram is obtained. And to construct the actual XYZ values, Y is stored along with xy. Together xyY forms the CIE xyY color space with xy as chromaticity coordinates and Y as a luminance value because we discussed earlier that the Y component roughly matches .
The RGB chromaticity diagram could be constructed by following the same procedure as XYZ. Here CIE rgG color space is constructed by keeping rg chromaticity coordinates and G value for luminance.
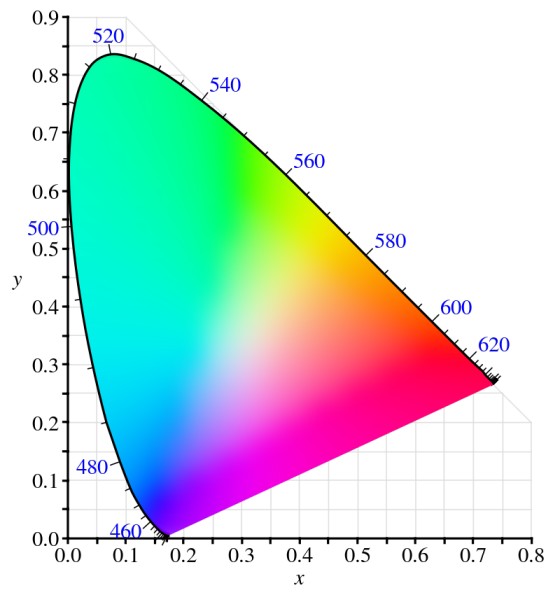 CIE xyY chromaticity diagram
The horseshoe shape in the above diagram contains all colors of the projected planar triangle. The chromaticity diagram is a mathematical representation of the human eye's color perception.
- The outer line of the spectral locus has colors with wavelengths distributed across in visible spectrum. Starting from violet to red and magenta line as a bridge between. These colors are hues or dominant wavelength colors which are seen in the rainbow.
- The region inside the spectral locus contains all colors possible in XYZ space that are visible to our human eyes. These colors are saturated colors of hues or a mixture of monochromatic wavelengths.
- A point (x, y) on the above graph matches a color in the xyY color space.
- It can be observed that CMY (cyan, magenta, yellow) colors lie between (green and blue), (blue and red), and (red and green). CMY colors are present in complement/opposite to RGB.
Color gamut
Color gamut describes a range of colors in the visible spectrum that are visible for human eyes. The color gamut of a device is that subset of color space that can be represented. color gamuts are generally a subset of the CIE chromaticity diagram with the center as a white point.
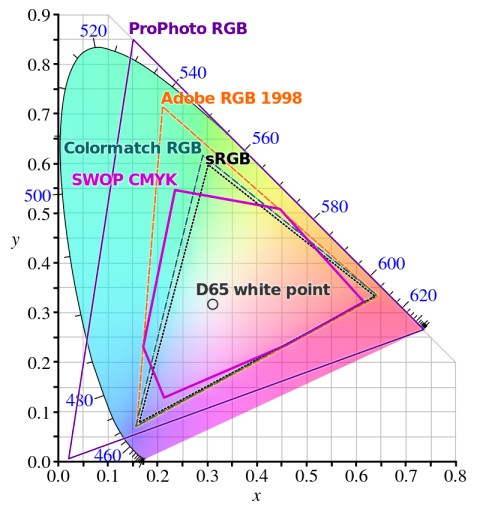 Different color gamuts in CIE xy chromaticity diagram
Color gamuts are color spaces enclosed by a triangle with color coordinates of the monitor as red, green, and blue colors. A gamut is a three-dimensional color space with lightness being the third dimension perpendicular to the chromaticity diagram.
Certain color gamuts are standardized by different institutions to reproduce the colors across different environments. The sRGB color gamut is the standard color subset used to display colors around the web.
The colors outside of the chromaticity diagram but inside a color gamut (like ProPhoto RGB) are called imaginary colors as they are not visible for human eyes and they look like normal visible colors. These colors can be detected using color measuring techniques but our eyes cannot differentiate those colors with normal visible colors.
Over time, different color spaces and techniques were developed to describe human color perception. Colorimetry and Spectrophotometry are two different methods to quantify the colors. CIE XYZ color spaces are also defined for the 10° standard observer, and it is the standard color space being used in the modern digital world. In the fields like image processing and digital photography, it is necessary to have a good grasp of concepts like chromaticity diagram and color gamuts that are useful for methods like color constancy, color correction, and color grading.
For further study about colors, check out the topics like color tolerance, color difference, conversion of different color gamuts between display systems, and additional color spaces like CIE LAB.
References
- How the CIE 1931 color matching functions were derived
- https://scholar.harvard.edu/files/schwartz/files/lecture17-color.pdf
- CIE 1931 color space - Wikipedia
- CIE color space - Gernot Hoffmann
- https://engineering.purdue.edu/~bouman/ece637/notes/pdf/Tristimulus.pdf
- http://graphics.stanford.edu/courses/cs148-10-summer/docs/02_light_color.pdf
- http://cs.haifa.ac.il/hagit/courses/ist/Lectures/IST03_ColorXYZx4.pdf
- http://www.cs.cmu.edu/afs/cs/academic/class/15462-s16/www/lec_slides/23_color.pdf
- https://web.eecs.umich.edu/~sugih/courses/eecs487/lectures/22-Light+Color.pdf
- Light, Color and Color Space - Scratch Pixel
- Color Matching - Craig Blackwell
- Visualizing the XYZ Color space
- A Beginner's Guide to Colorimetry
- Precise Color Communincation - Konica Minolta
- Color Gamut - Epxx
- http://www.marcelpatek.com/color.html
- https://www.oceanopticsbook.info/view/photometry-and-visibility/chromaticity
- https://www.thebroadcastbridge.com/content/entry/14426/color-and-colorimetry-part-7-cie-xyz